Demystifying Data: Understanding the Costs and Efficiency
Sack the analyst- Data Scientist v Analyst v Athlete Management System
In the modern landscape of sports management, data has become a pivotal asset for driving performance and making informed decisions. Yet, the question remains: What's the most cost-effective and efficient way to harness this data powerhouse?
The Role Breakdown: Data Scientist vs. Data Analyst vs. Athletic Management System (AMS)
- Data Scientist: Delving into complex algorithms and predictive modelling, a data scientist commands a high skill set. However, this expertise comes at a premium cost. We'll explore the financial investment in hiring a data scientist and the intricate output they provide.
- Data Analyst: Often considered the bridge between raw data and actionable insights, a data analyst focuses on interpreting data to aid decision-making. We'll delve into the cost-effectiveness of employing a data analyst and the practical outcomes they deliver.
- Athletic Management System (AMS): An all-encompassing platform designed to streamline athlete management, an AMS offers data aggregation, analysis, and visualization tools. We'll discuss the comparative cost and efficiency benefits of utilizing an AMS over hiring dedicated data professionals.
Cost Comparison: Understanding the Financial Investment
- Data Scientist: Exploring the substantial investment required in recruiting and retaining a data scientist, including salary, benefits, and ongoing training costs.
- Data Analyst: Analyzing the financial outlay for employing a data analyst, including salaries, software, and tools required for data interpretation.
- AMS: Unveiling the comparative costs of implementing an AMS, considering initial setup, subscription fees, and potential customization.
Efficiency and Output: Maximizing Value from Data
- Data Scientist Output: Highlighting the advanced predictive modelling, machine learning algorithms, and in-depth data mining capabilities that a data scientist brings to the table.
- Data Analyst Output: Illustrating the actionable insights, visualizations, and reporting delivered by a data analyst, aiding in decision-making processes.
- AMS Output: Showcasing the comprehensive data aggregation, streamlined athlete management, real-time analytics, and performance tracking offered by an AMS.
Conclusion: Finding the Optimal Solution
In today's data-driven sports environment, every penny counts. From a data scientist's intricate capabilities to a data analyst's interpretive prowess and the comprehensive efficiency of an AMS, there's a solution for every budget and need.
Join us as we break down the costs and efficiencies of these data-driven solutions, aiding sports professionals in making informed decisions to maximize their investment in data management.
MVP Analytics- The Solution
MVP Analytics offers a cost-effective, easy solution to your data needs, those needs could be as simple as comparing 2 tests across all of your athletes (figure 2) or mapping out the most physically dominant athletes across the whole of the USA based on all existing combine data.
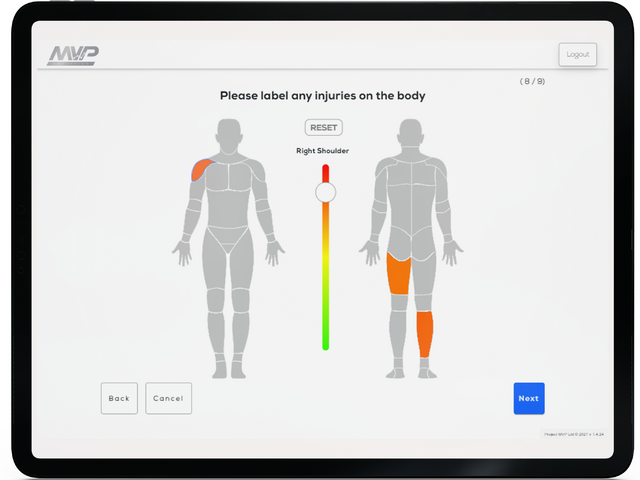
Figure 1-
American Football Simulators:
- Have you ever wondered what your fastest team would look like? Perhaps you want to field your heaviest Offensive line?
- This is all possible with MVP Analytics' squad simulators. Filter your team depending on specific physical qualities. Obviously, American Football is a game which demands multiple physical qualities in different positions. MVP Analytics allows you to select different physical qualities as filters for different positions.
- This can be used in real-world situations e.g. You're aware your upcoming opposition has rapid wide receivers, so you need your fastest cornerbacks and linebackers on the pitch to cover.
- Equally, you might want to play a power game and field your heaviest linemen, and most powerful running backs.
- This could also be used to look at potential position changes. For example, you filter the simulator to show your fastest offense and defence. You realise that some players are physical enough to play both ways, so this opens the door to changing their position.

Figure 2-
This screenshot, taken from MVP Analytics, illustrates the longitudinal tracking of athletes' performance in their IMTP Total strength test over time. These graphs, instantly available upon the latest attempt's registration within the MVP Analytics app, provide a seamless way to monitor the progress of individual athletes or groups across various tests. With every new data entry, the graph automatically updates, displaying the trajectory of improvement. This feature ensures data continuity, offering coaches a valuable tool to gain an overview of an athlete's progress. It proves especially beneficial for new coaches, granting them immediate insight into the team's historical performance, aiding their understanding of individual athlete development within the context of the team's trajectory.
![]()
Thanks for taking the time to read our blog, was this information useful?
Do you have any suggestions for future blogs?
Would you like to discuss our software and performance testing days?
If the answer to any of the above questions is yes, please contact Matthew Clement at matthew@projectmvp.co.uk
#DataDrivenDecisions #AthleteManagement #SportsAnalytics #PerformanceOptimization #DataScientists #DataAnalytics #AthleteDevelopment #EfficiencyInSports #CostEffectiveData #SportsTech #DataManagement #AthleticPerformance #MaturationInSports #AthleteMonitoring #MVPAnalytics #DataSolutions #InformedDecisions #SportsInsights #SportScience #AthleteMaturation